
Group Local Projections
Last Update:
Below I plot group-level impulse responses of US MSA-level housing prices to tightening monetary shocks.
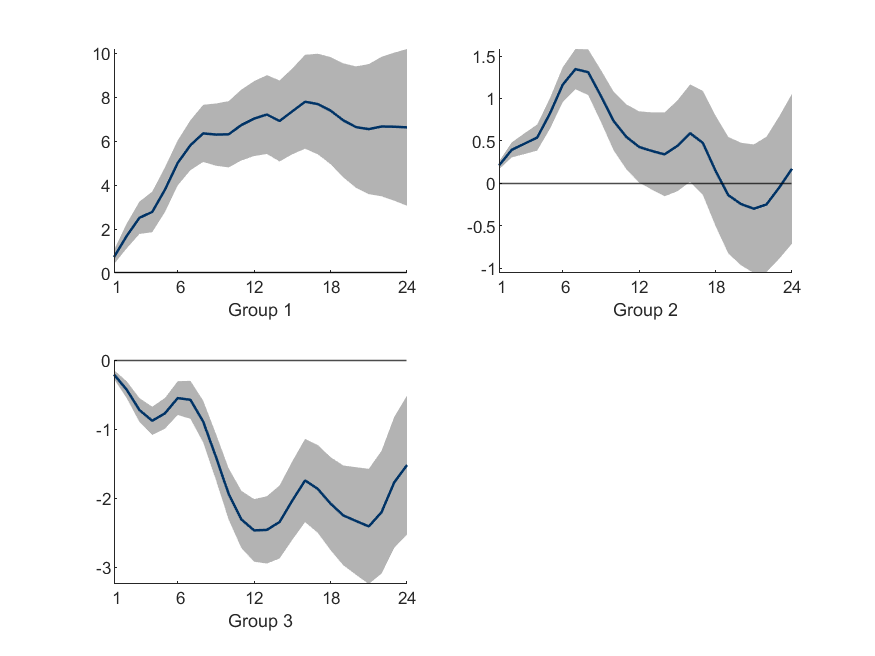
The GLP recovers three distinct responses:
- considerable housing appreciation (Group 1)
- Group 1 is more economically developed: with only 6.3% of the MSAs, this group accounts for 13.1% of the total personal income in the sample
- it also has more regulated housing markets, less elastic house supply, and more indebted households
- overall, this group seems to fit the “housing bubbles” narrative
- muted responses (Group 2)
- significant depreciation (Group 3)
- although with completely different responses, Group 3 is also inhabited by heavily indebted households
- so if we use pre-defined criteria, like debt-to-income ratio, we will mix the responses in Group 1 and 3