
Functional VAR
Last Update:
The main advantage of the FVAR approach can be illustrated by the following graph:
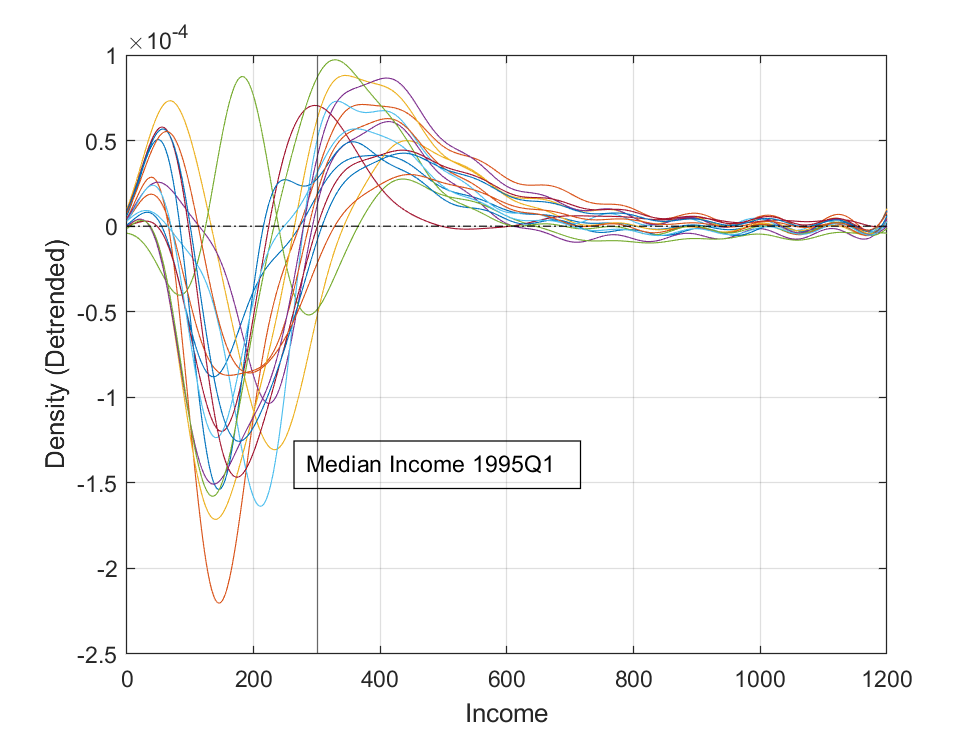
Here, I plot the impulse responses of income density functions to unexpected tax cuts. It shows that following a tax cut
there is a decrease in the share of lower-middle-class households
the majority of this share decrease is offset by increases in the upper range of the distribution
the share of households at the left tail also increases, but with smaller magnitude
Overall, it suggests that lower-middle-class households are better off, but policymaker need to pay extra attention to the left tail.
The distributional effects give different policy implication than conventional methods, e.g., using Gini coefficients as summary statistics:
we will find that Gini coefficients increase following tax cuts, raising inequality concern
but the above graph shows that the increases in Gini coefficients are mechanical, resulting from a shrinking lower-middle-class
- remember, most of this share decrease is compensated for by the increase in the richer range